
What's new, in 30 seconds
- Prop AnalytiX Analysis Extension (free on Chrome): captures 12 months of rates and occupancy from PriceLabs or Property Market Intel while you browse.
- One-click auto-fill into the Prop AnalytiX Calculator, with a seasonal plan built for you.
- Every cost in one place: property and business expenses, platform fees and VAT, and your initial investment, with AI Low / Medium / High estimates built in.
- Gross and net revenue, month by month, plus monthly profit and ROI.
- Investor-ready PDF and JV splits for up to four partners.
Why we built this
I've coached more than 500 newcomers into the short-term rental market, and almost all of them used PriceLabs, AirDNA or Property Market Intel to research their first deal. The research tools are brilliant at one question: how much revenue could this property make?
But revenue isn't what lands in your bank account. Rent, energy, cleaning, management, platform fees and council tax all come out first. And because short-term rentals are a seasonal business, your net profit changes every month.
Most hosts work around that with one average daily rate and one occupancy figure for the whole year. With Prop AnalytiX, you don't need an average. You can forecast month by month, based on the real swings in revenue and occupancy.
Research tools tell you what a property could earn. Prop AnalytiX tells you what it could keep.
So we built two tools that work side by side. The Analysis Extension pulls the numbers. The Calculator turns them into a net forecast you can act on.
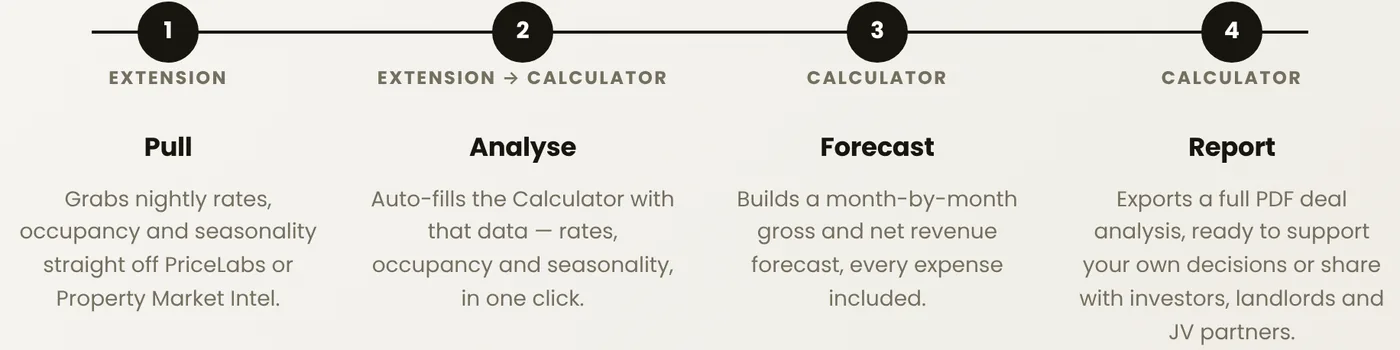
How it works: Pull → Analyse → Forecast → Report
The whole journey, from a PriceLabs tab to a shareable deal analysis, is four steps.
The new features, one by one
Pull real data, straight off the page
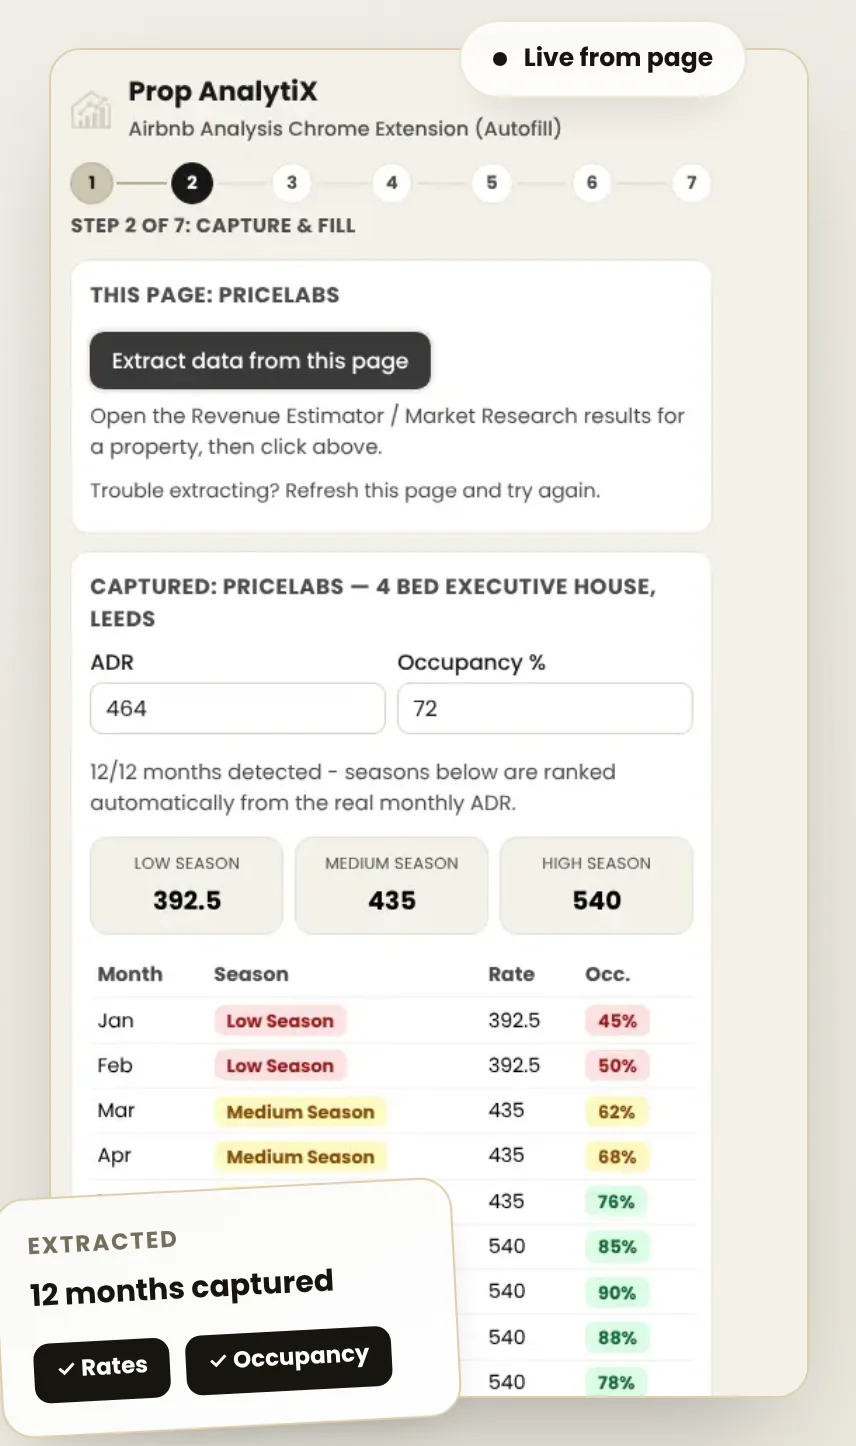
Open the Revenue Estimator or Market Research results for a property in PriceLabs (or a report in Property Market Intel), click Extract data from this page, and the extension captures the average daily rate, occupancy and all 12 months of seasonality.
You start on PriceLabs or Property Market Intel as usual. Once the data is captured and you're in the Calculator, there's no more switching between tabs and no retyping numbers into a spreadsheet.
A 12-month seasonal plan, built for you
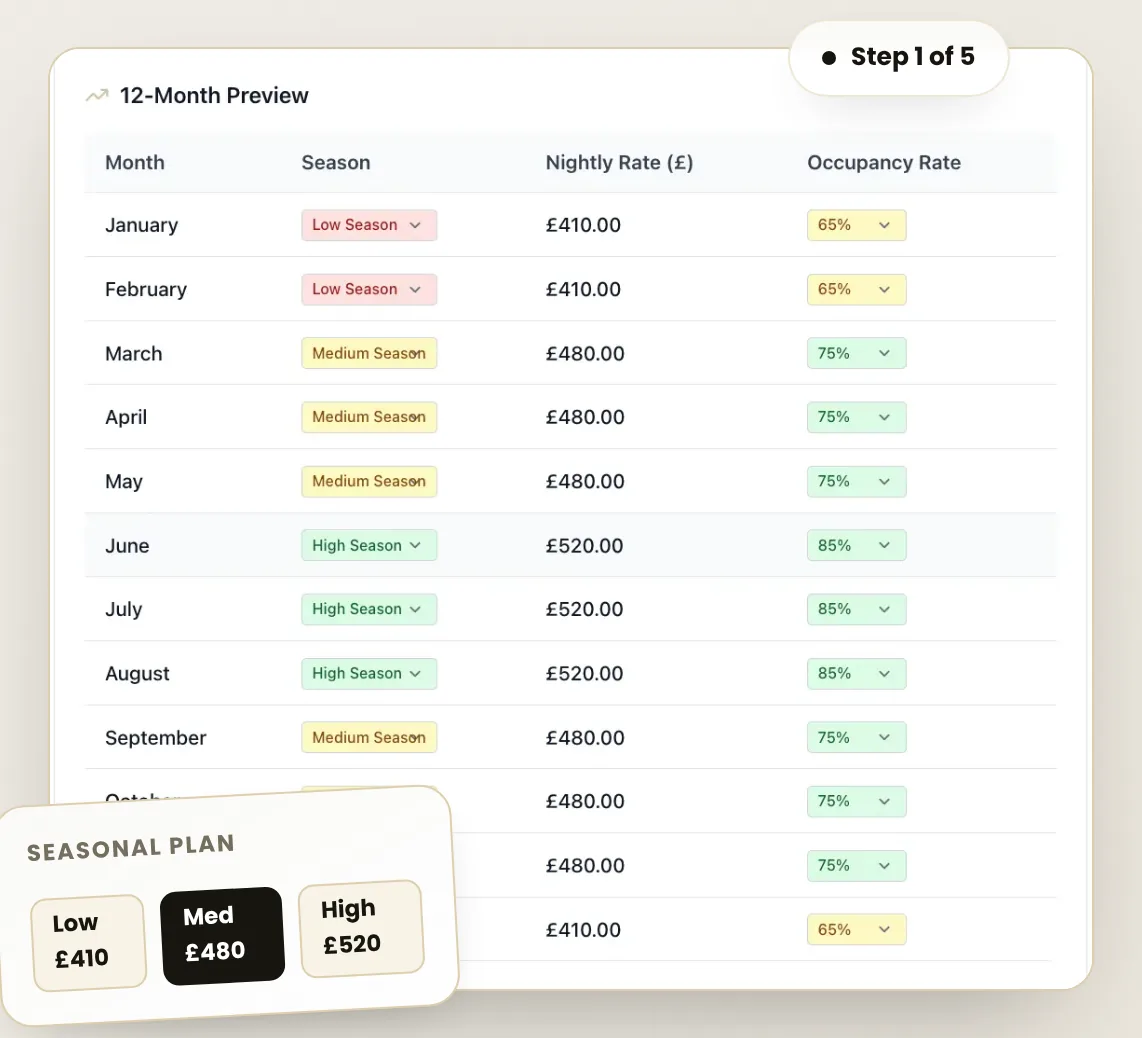
The captured data lands in the Calculator as a ready-made seasonal plan: every month tagged Low, Medium or High season, with its nightly rate and occupancy variation already filled in.
Already have numbers from your own research? Type them straight into Step 1 instead. Everything stays editable.
Every expense, forecasted, not forgotten
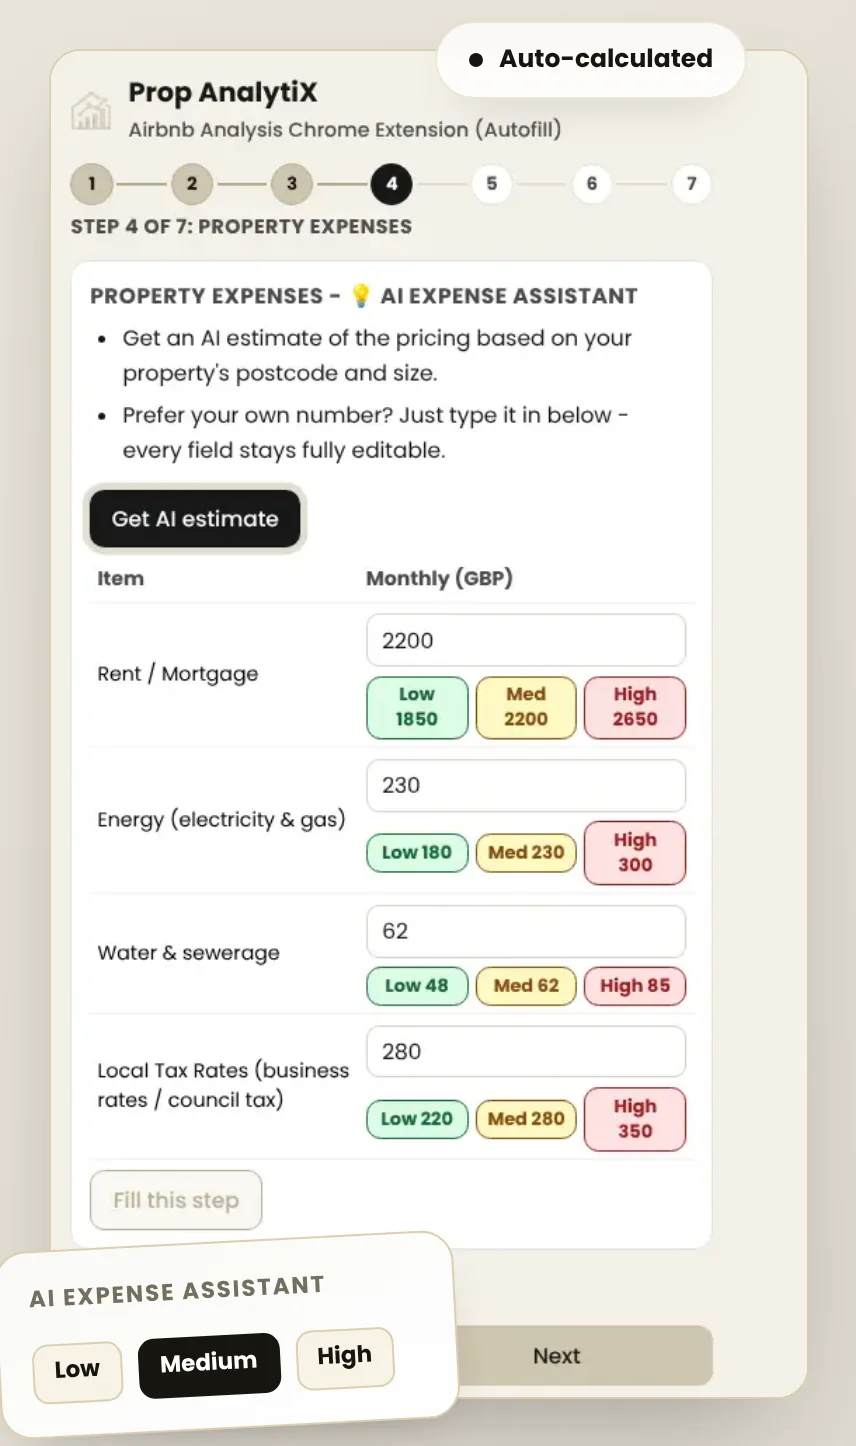
Most tools stop at a few bills. The Calculator takes you through the full cost of running a short-term rental:
- Property expenses: rent or mortgage, energy, water, council tax or business rates
- Business expenses: property and channel management, pricing software, cleaning, laundry, household supplies, Wi-Fi, TV subscriptions, insurance, noise sensors, CCTV, key storage and other outgoings
- Platform and payment fees: OTA commission, VAT on commission, payment and merchant fees
- Initial investment: sourcing fee, first month's rent, deposit, legal costs, references, furnishing, refurbishment, deep clean, channel manager and OTA setup fees, management onboarding fee and other property services
The free, built-in AI Expense Assistant gives you Low, Medium and High estimates based on the property's postcode and size. Pick the range that fits your deal, or type your own number.
Gross and net, side by side
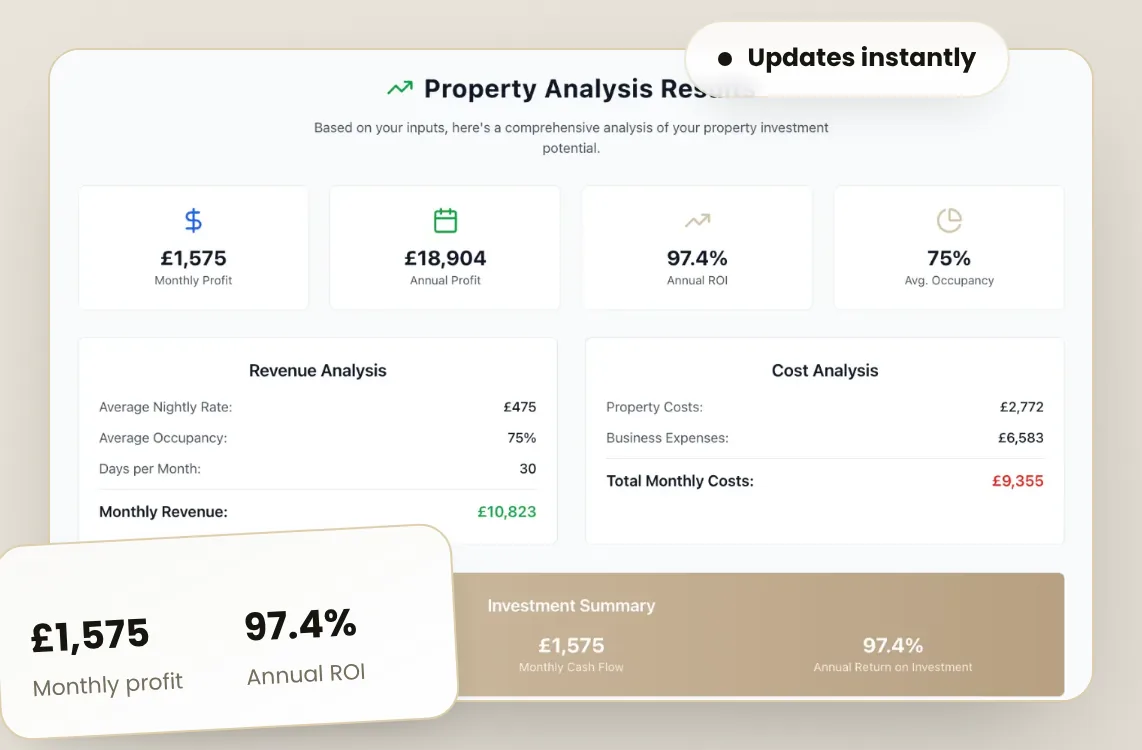
With revenue and costs in place, the Calculator builds the full picture: monthly and annual profit, annual ROI, average occupancy, a revenue analysis and a cost analysis.
Change any input, such as a lower nightly rate, a quieter winter or higher cleaning costs, then recalculate to see your Monthly Profit and Annual ROI update.
A report your investors will trust
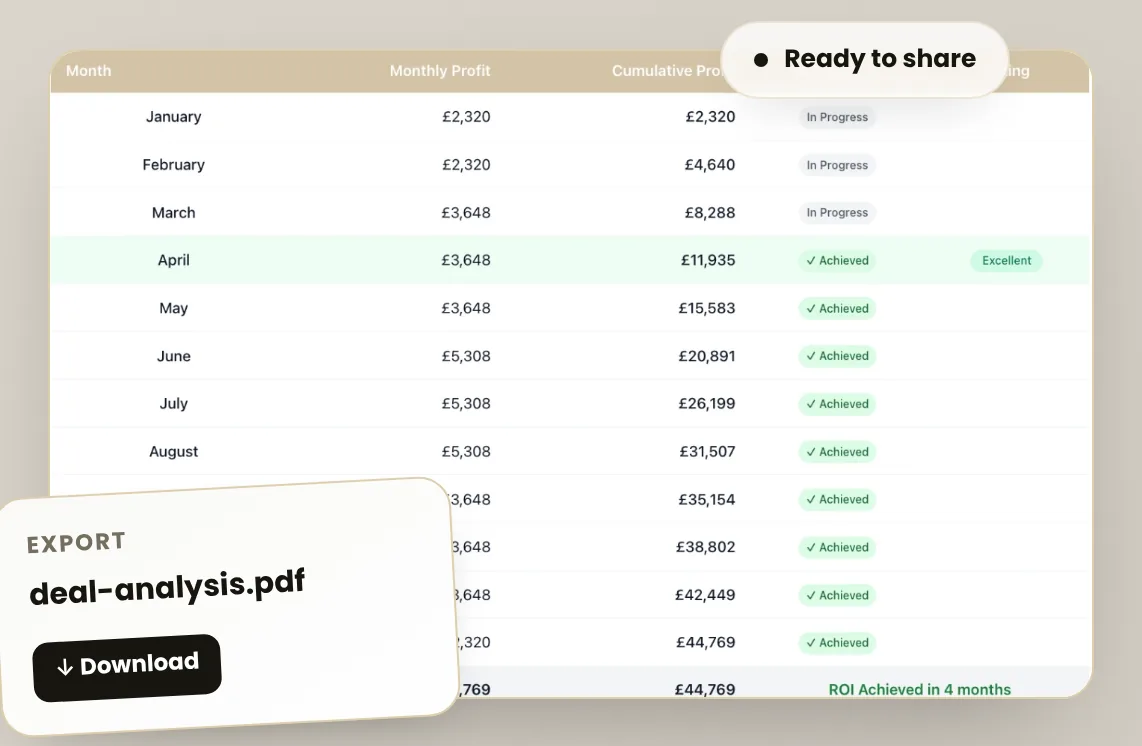
Export a full PDF deal analysis with month-by-month profit, cumulative profit and the month you hit your return on investment.
Because it accounts for seasonal variation and the full range of expenses, the forecast is more accurate. You can see how long your return on investment will realistically take, so you don't overestimate it.
Use it for your own decision, or share it with an investor, landlord or JV partner. It's backed by data rather than word of mouth or gut feel, and it replaces the spreadsheet screenshot or slideshow.
Built for JV deals from day one
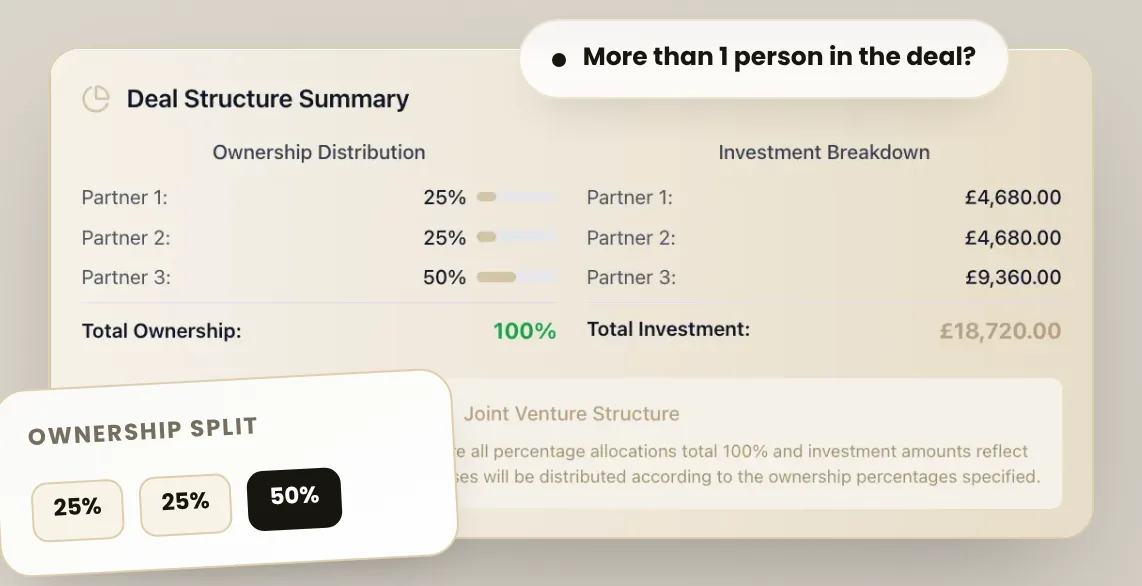
Running the numbers with partners? Add up to four JV partners, set each one's ownership percentage, and the Calculator splits the investment and the returns automatically.
Before and after: the spreadsheet vs Prop AnalytiX
| Task | The old way | With Prop AnalytiX |
|---|---|---|
| Rates and occupancy | One flat average for the whole year, so you're guessing what any single month really looks like | An accurate reflection of ADR and occupancy for every month, captured in one click |
| Seasonality | Seasonal swings get buried in the average, making it harder to forecast and visualise how they hit your profit | See your low, medium and high seasons coming, ranked from accurate monthly ADR reflections |
| Running costs | Pieced together from different places, with easily missed costs (commission fees, business subscriptions, cleaning turnovers, VAT) quietly eating your profit | Every cost in one place, accurately estimated with AI and a step-by-step guide so nothing slips through |
| Profit | Revenue minus a rough guess, which often makes a deal look more profitable than it is | Gross and net profit for every month, so you know what you'll actually keep |
| Sharing the deal | A spreadsheet screenshot or slideshow that's easy to question and hard to trust | A professional PDF with a clear, data-backed ROI timeline |
| Partners | Complicated side calculations every time the deal structure changes or a new investor or JV partner is added | Add up to four JV partners, set each share, and see each partner's monthly profit split alongside the ROI payback term, not just the financial return |
Who it's for
Rent-to-rent operators
Check a property still makes money after rent and bills before you sign a lease.
Co-hosts and managers
Show a landlord a realistic net forecast, not a revenue headline.
Investors and buyers
Compare deals on net profit and ROI, month by month.
JV partners
Agree the numbers and the split from one shared report.
What's next
Here's where our integrations stand:
Got a feature request? Email support@propanalytix.com. We read every one.
FAQs
Do I need a PriceLabs or Property Market Intel account?
To use the auto-fill, yes. The extension reads data from your own PriceLabs or Property Market Intel account while you're logged in. If you already have the numbers, you can type them straight into the Calculator.
Is the Analysis Extension free?
Yes. It's free to add from the Chrome Web Store, and the AI Expense Assistant is built in.
Does the extension see my login details?
No. It runs locally in your browser, reads the figures shown on the page, and never touches your credentials.
Does it work with AirDNA?
Not yet. AirDNA support is next on the roadmap.
Can I change the numbers it pulls in?
Yes. Every field stays fully editable, including the AI expense estimates.
See what your next deal could actually keep
Add the extension, open a property in PriceLabs, and have a net forecast in front of you in minutes.
No payment required · takes under 2 minutes to set up