

Property Market Intel lets you look at the same market through different price tiers, from Budget all the way up to Luxury. So one address can turn into several very different deals, depending on how you position it.
Most hosts pick the tier with the highest nightly rate. That's the trap. Going upmarket lifts your rate, but it also lifts everything you spend before your first guest walks in: furnishing, refurbishment, the deep clean, higher-spec supplies. A bigger rate can mean a much longer wait to get your money back.
So the real question isn't "which earns more?" It's "which earns my money back first, and which keeps paying after that?"
Here's how to answer it in minutes, before you spend a penny on furniture.
What you'll need
- A Property Market Intel account
- A Prop AnalytiX Calculator account
- The free Prop AnalytiX Analysis Extension for Chrome
The 5 steps
-
Go to the Rates page for your market
The extension reads from the Rates page, so open your market in Property Market Intel and head there first.
-
Choose the price tier you're considering
Pick the positioning you want to test, for example Budget or Luxury. Each tier has its own nightly rates and occupancy pattern across the year, so each one tells a different story.
-
Click Extract data from page
Open the Prop AnalytiX extension and click Extract data from page. It captures every month's rate and occupancy for that price tier and builds your seasonal plan in the Calculator.
-
Match your costs to your positioning
This is where most comparisons go wrong. Luxury rates need luxury setup costs. Update your initial investment (furnishing, refurbishment, deep clean) and your running costs (cleaning, laundry, household supplies) to suit the price tier you chose.
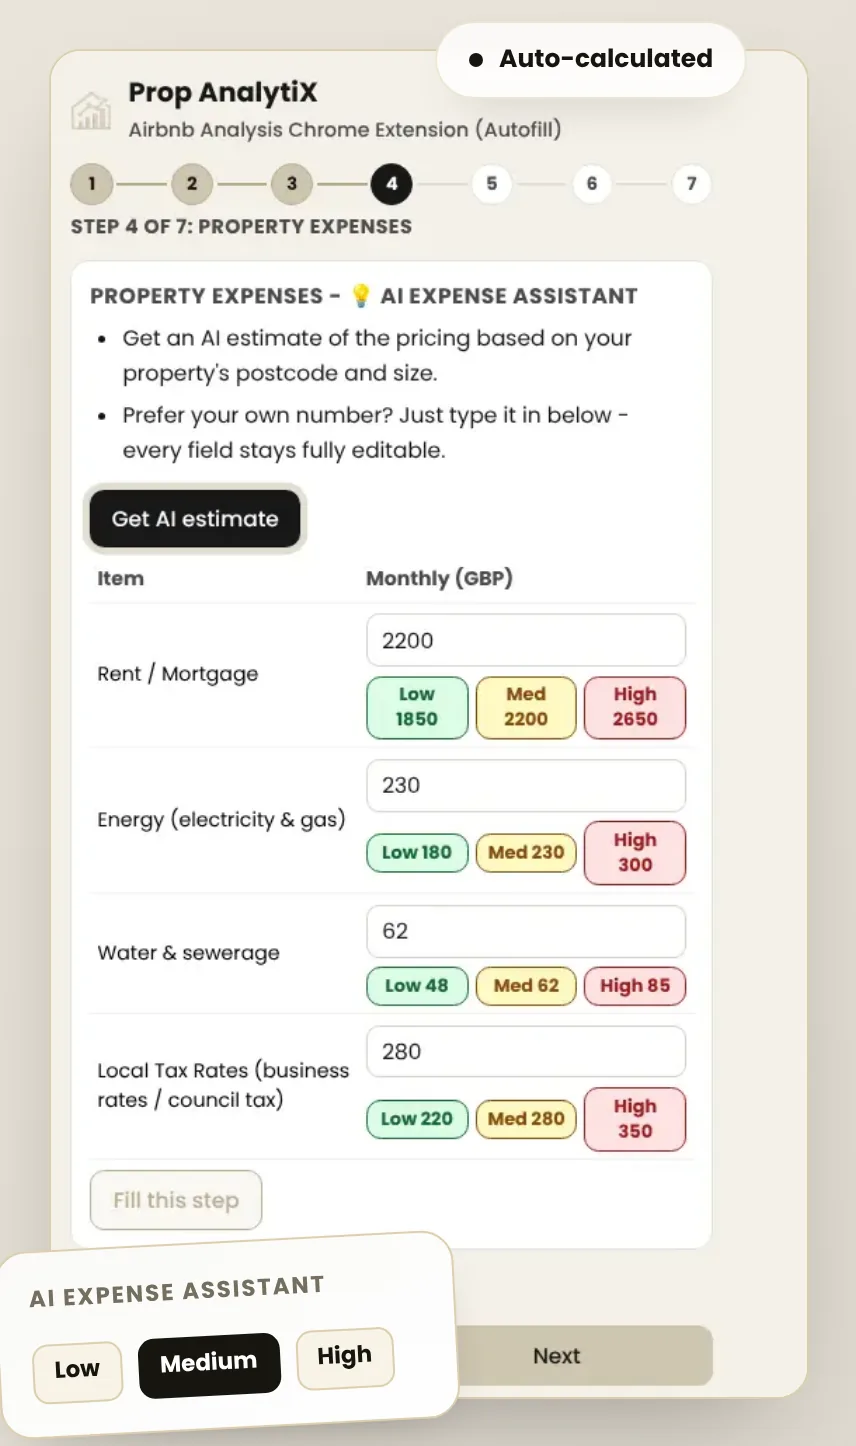
-
Repeat for another price tier and compare
Run the same property as Budget and as Luxury, then compare monthly profit, annual ROI and the month each one pays back. Export the winner as a PDF for your landlord, investor or JV partner.
Why it matters
Choosing a positioning on revenue alone is how hosts overspend on setup and wait far longer for their return. Forecasting each option month by month, with matching costs, shows you the real trade-off before you buy a single sofa. For why month by month matters, read the average ADR trap.
Using PriceLabs instead? Follow the PriceLabs guide.
FAQs
Do I need a Property Market Intel account?
Yes, to use the auto-fill. The extension reads the figures from your own Property Market Intel account while you're logged in.
Which page does the extension read from?
The Rates page for your market in Property Market Intel.
Is the extension free?
Yes. It's free to add from the Chrome Web Store.
Pick the positioning that pays you back first
Add the free extension and compare every price tier on net profit in minutes.
No payment required · takes under 2 minutes to set up